What is greenhouse emissions
What is greenhouse emissions
Climate Change Indicators: Greenhouse Gases
View Indicators:
Greenhouse gases from human activities are the most significant driver of observed climate change since the mid-20th century. 1 The indicators in this chapter characterize emissions of the major greenhouse gases resulting from human activities, the concentrations of these gases in the atmosphere, and how emissions and concentrations have changed over time. When comparing emissions of different gases, these indicators use a concept called “global warming potential” to convert amounts of other gases into carbon dioxide equivalents.
Why does it matter?
As greenhouse gas emissions from human activities increase, they build up in the atmosphere and warm the climate, leading to many other changes around the world—in the atmosphere, on land, and in the oceans. The indicators in other chapters of this report illustrate many of these changes, which have both positive and negative effects on people, society, and the environment—including plants and animals. Because many of the major greenhouse gases stay in the atmosphere for tens to hundreds of years after being released, their warming effects on the climate persist over a long time and can therefore affect both present and future generations.
Summary of Key Points
Major Long-Lived Greenhouse Gases and Their Characteristics
| Greenhouse gas | How it’s produced | Average lifetime in the atmosphere | 100-year global warming potential |
|---|---|---|---|
| Carbon dioxide | Emitted primarily through the burning of fossil fuels (oil, natural gas, and coal), solid waste, and trees and wood products. Changes in land use also play a role. Deforestation and soil degradation add carbon dioxide to the atmosphere, while forest regrowth takes it out of the atmosphere. | see below * | 1 |
| Methane | Emitted during the production and transport of oil and natural gas as well as coal. Methane emissions also result from livestock and agricultural practices and from the anaerobic decay of organic waste in municipal solid waste landfills. | 11.8 years | 27.0–29.8 ** |
| Nitrous oxide | Emitted during agricultural and industrial activities, as well as during combustion of fossil fuels and solid waste. | 109 years | 273 |
| Fluorinated gases | A group of gases that contain fluorine, including hydrofluorocarbons, perfluorocarbons, and sulfur hexafluoride, among other chemicals. These gases are emitted from a variety of industrial processes and commercial and household uses and do not occur naturally. Sometimes used as substitutes for ozone-depleting substances such as chlorofluorocarbons. | A few weeks to thousands of years | Varies (the highest is sulfur hexafluoride at 25,200) |
This table shows 100-year global warming potentials, which describe the effects that occur over a period of 100 years after a particular mass of a gas is emitted. Global warming potentials and lifetimes come from Tables 7.15 and 7.SM.7 of the Intergovernmental Panel on Climate Change’s Sixth Assessment Report, Working Group I contribution. 3
* Carbon dioxide’s lifetime cannot be represented with a single value because the gas is not destroyed over time, but instead moves among different parts of the ocean–atmosphere–land system. Some of the excess carbon dioxide is absorbed quickly (for example, by the ocean surface), but some will remain in the atmosphere for thousands of years, due in part to the very slow process by which carbon is transferred to ocean sediments.
** Methane’s global warming potential is shown as a range that includes methane from both fossil and non-fossil sources.
See Understanding Global Warming Potentials to learn more about the numbers in the table above and the versions EPA uses for various calculations.
Sources of Data on U.S. Greenhouse Gas Emissions
EPA has two key programs that provide data on greenhouse gas emissions in the United States: the Inventory of U.S. Greenhouse Gas Emissions and Sinks and the Greenhouse Gas Reporting Program. The programs are complementary, providing both a higher-level perspective on the nation’s total emissions and detailed information about the sources and types of emissions from individual facilities. The data in EPA’s U.S. Greenhouse Gas Emissions indicator come from the national inventory.
EPA’s Inventory of Greenhouse Gas Emissions and Sinks
EPA develops an annual report called the Inventory of U.S. Greenhouse Gas Emissions and Sinks (or the GHG Inventory). This report tracks trends in total annual U.S. emissions by source (or sink), economic sector, and greenhouse gas going back to 1990. EPA uses national energy data, data on national agricultural activities, and other national statistics to provide a comprehensive accounting of total greenhouse gas emissions for all man-made sources in the United States. This inventory fulfills the nation’s obligation to provide an annual emissions report under the United Nations Framework Convention on Climate Change.
EPA’s Greenhouse Gas Reporting Program
Since 2010, EPA’s Greenhouse Gas Reporting Program has been collecting annual emissions data from industrial sources that directly emit large amounts of greenhouse gases. Generally, facilities that emit more than 25,000 metric tons of carbon dioxide equivalents per year are required to report. The program also collects data from entities known as «suppliers» that supply certain fossil fuels and industrial gases that will emit greenhouse gases into the atmosphere if burned or released—for example, refineries that supply petroleum products such as gasoline. The Greenhouse Gas Reporting Program only requires reporting; it is not an emissions control program. This program helps EPA and the public understand where greenhouse gas emissions are coming from, and will improve our ability to make informed policy, business, and regulatory decisions.
Learn more about the Greenhouse Gas Reporting Program and explore data by facility, industry, location, or gas using a data visualization and mapping tool called FLIGHT. You can also review state- or tribal-specific emissions using interactive fact sheets and download detailed data via EPA’s Envirofacts database.
Overview of Greenhouse Gases
On this page:
Total U.S. Emissions in 2020 = 5,981 Million Metric Tons of CO2 equivalent (excludes land sector). Percentages may not add up to 100% due to independent rounding.
Gases that trap heat in the atmosphere are called greenhouse gases. This section provides information on emissions and removals of the main greenhouse gases to and from the atmosphere. For more information on the other climate forcers, such as black carbon, please visit the Climate Change Indicators: Climate Forcing page.
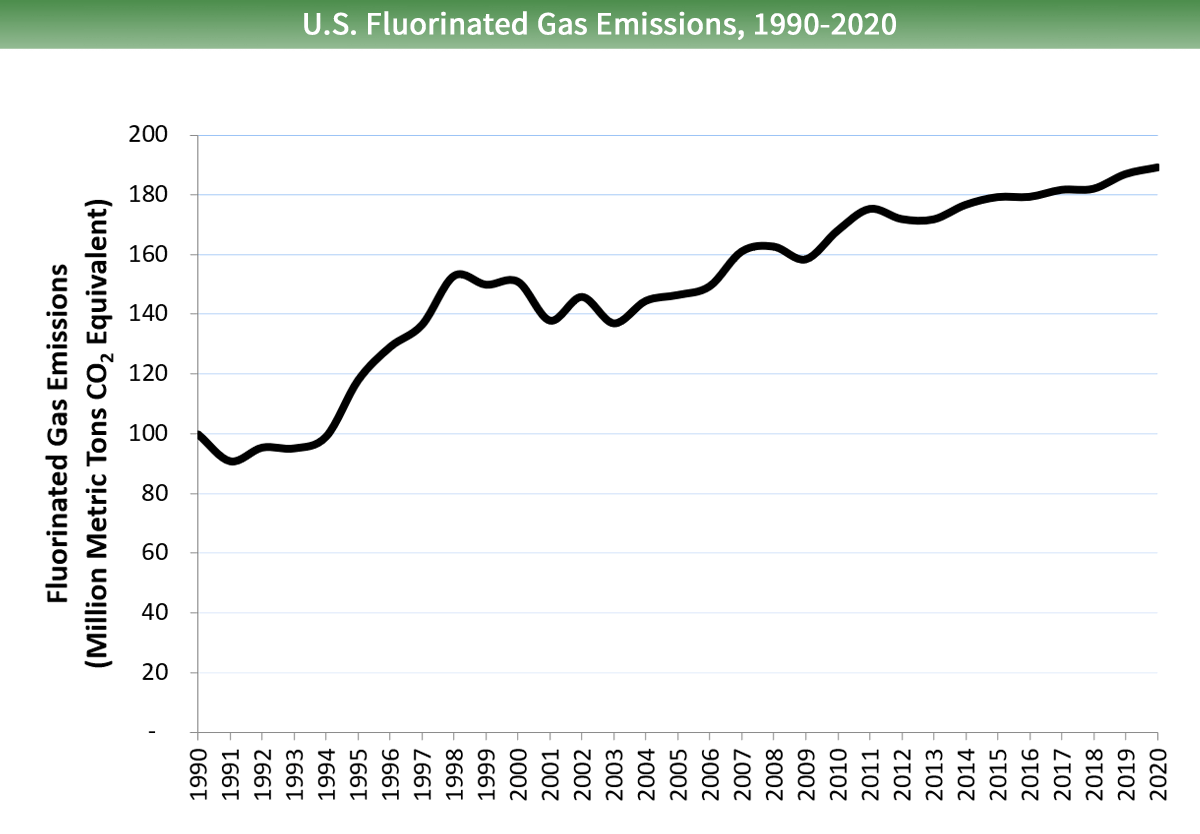
Fluorinated gases : Hydrofluorocarbons, perfluorocarbons, sulfur hexafluoride, and nitrogen trifluoride are synthetic, powerful greenhouse gases that are emitted from a variety of household, commercial, and industrial applications and processes. Fluorinated gases (especially hydrofluorocarbons) are sometimes used as substitutes for stratospheric ozone-depleting substances (e.g., chlorofluorocarbons, hydrochlorofluorocarbons, and halons). Fluorinated gases are typically emitted in smaller quantities than other greenhouse gases, but they are potent greenhouse gases. With global warming potentials (GWPs) that typically range from thousands to tens of thousands, they are sometimes referred to as high-GWP gases because, for a given amount of mass, they trap substantially more heat than CO2.
Each gas’s effect on climate change depends on three main factors:
How much is in the atmosphere?
Concentration, or abundance, is the amount of a particular gas in the air. Larger emissions of greenhouse gases lead to higher concentrations in the atmosphere. Greenhouse gas concentrations are measured in parts per million, parts per billion, and even parts per trillion. One part per million is equivalent to one drop of water diluted into about 13 gallons of liquid (roughly the fuel tank of a compact car). To learn more about the increasing concentrations of greenhouse gases in the atmosphere, visit the Climate Change Indicators: Atmospheric Concentrations of Greenhouse Gases page.
How long do they stay in the atmosphere?
Each of these gases can remain in the atmosphere for different amounts of time, ranging from a few years to thousands of years. All of these gases remain in the atmosphere long enough to become well mixed, meaning that the amount that is measured in the atmosphere is roughly the same all over the world, regardless of the source of the emissions.
How strongly do they impact the atmosphere?
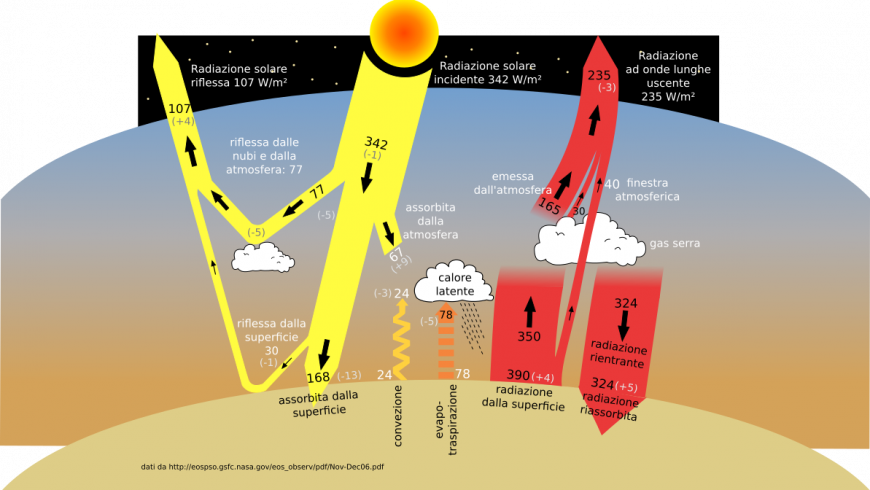
Some gases are more effective than others at making the planet warmer and «thickening the Earth’s blanket.»
For each greenhouse gas, a Global Warming Potential (GWP) was developed to allow comparisons of the global warming impacts of different gases. Specifically, it is a measure of how much energy the emissions of 1 ton of a gas will absorb over a given period of time, relative to the emissions of 1 ton of carbon dioxide (CO2). Gases with a higher GWP absorb more energy, per pound emitted, than gases with a lower GWP, and thus contribute more to warming Earth.
Carbon Dioxide Emissions
Chemical Formula: CO2
Lifetime in Atmosphere: See below 1
Global Warming Potential (100-year): 1
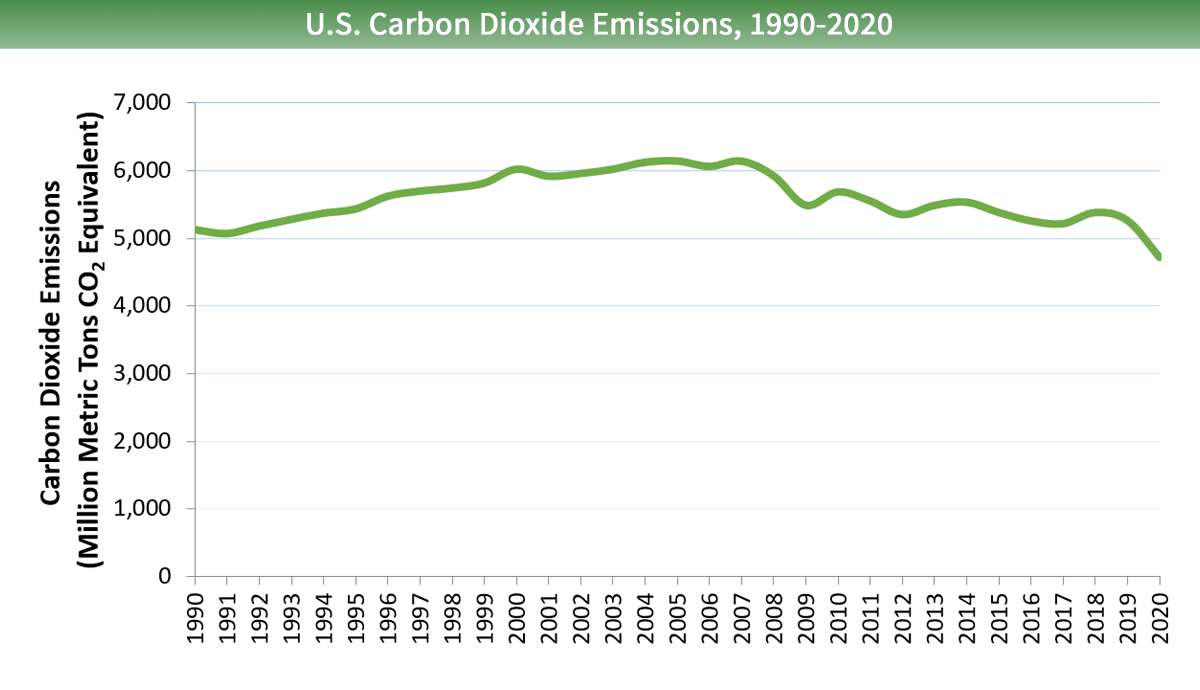
Carbon dioxide (CO2) is the primary greenhouse gas emitted through human activities. In 2020, CO2 accounted for about 79% of all U.S. greenhouse gas emissions from human activities. Carbon dioxide is naturally present in the atmosphere as part of the Earth’s carbon cycle (the natural circulation of carbon among the atmosphere, oceans, soil, plants, and animals). Human activities are altering the carbon cycle–both by adding more CO2 to the atmosphere and by influencing the ability of natural sinks, like forests and soils, to remove and store CO2 from the atmosphere. While CO2 emissions come from a variety of natural sources, human-related emissions are responsible for the increase that has occurred in the atmosphere since the industrial revolution. 2
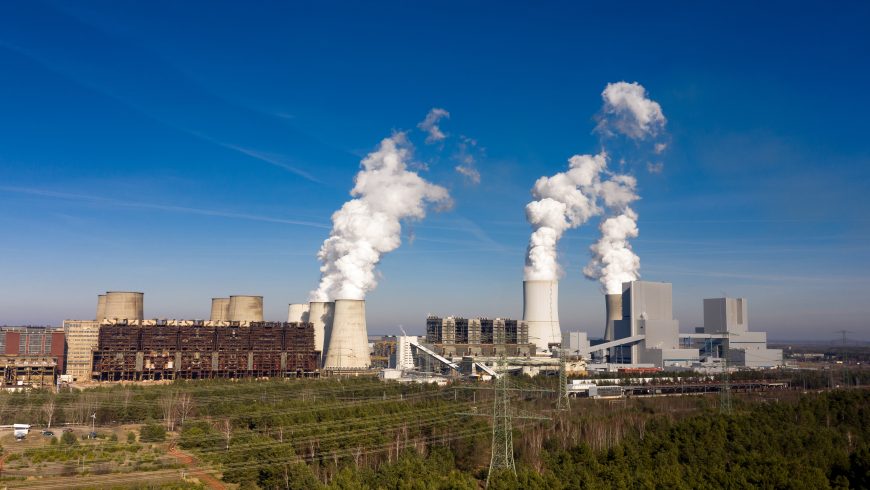
The main human activity that emits CO2 is the combustion of fossil fuels (coal, natural gas, and oil) for energy and transportation. Certain industrial processes and land-use changes also emit CO2. The main sources of CO2 emissions in the United States are described below.
Carbon dioxide is constantly being exchanged among the atmosphere, ocean, and land surface as it is both produced and absorbed by many microorganisms, plants, and animals. Emissions and removal of CO2 by these natural processes, however, tend to balance, absent anthropogenic impacts. Since the Industrial Revolution began around 1750, human activities have contributed substantially to climate change by adding CO2 and other heat-trapping gases to the atmosphere.
In the United States, the management of forests and other land (e.g., cropland, grasslands, etc.) has acted as a net sink of CO2, which means that more CO2 is removed from the atmosphere, and stored in plants and trees, than is emitted. This carbon sink offset is about 14% of total emissions in 2020 and is discussed in more detail in the Land Use, Land-Use Change, and Forestry section.
To find out more about the role of CO2 in warming the atmosphere and its sources, visit the Climate Change Indicators page.
Emissions and Trends
Carbon dioxide emissions in the United States decreased by about 8% between 1990 and 2020. Since the combustion of fossil fuel is the largest source of greenhouse gas emissions in the United States, changes in emissions from fossil fuel combustion have historically been the dominant factor affecting total U.S. emission trends. Changes in CO2 emissions from fossil fuel combustion are influenced by many long-term and short-term factors, including population growth, economic growth, changing energy prices, new technologies, changing behavior, and seasonal temperatures. In 2020, the decrease in CO2 emissions from fossil fuel combustion corresponded with a decrease in energy use as a result of decreases in economic, manufacturing, and travel activity in response to the coronavirus pandemic, in addition to a continued shift from coal to less carbon-intensive natural gas and renewables in the electric power sector.
Reducing Carbon Dioxide Emissions
The most effective way to reduce CO2 emissions is to reduce fossil fuel consumption. Many strategies for reducing CO2 emissions from energy are cross-cutting and apply to homes, businesses, industry, and transportation.
EPA is taking common sense regulatory actions to reduce greenhouse gas emissions.
Improving the insulation of buildings, traveling in more fuel-efficient vehicles, and using more efficient electrical appliances are all ways to reduce energy use, and thus CO2 emissions.
Reducing personal energy use by turning off lights and electronics when not in use reduces electricity demand. Reducing distance traveled in vehicles reduces petroleum consumption. Both are ways to reduce energy CO2 emissions through conservation.
Learn more about What You Can Do at Home, at School, in the Office, and on the Road to save energy and reduce your carbon footprint.
Producing more energy from renewable sources and using fuels with lower carbon contents are ways to reduce carbon emissions.
Carbon dioxide capture and sequestration is a set of technologies that can potentially greatly reduce CO2 emissions from new and existing coal- and gas-fired power plants, industrial processes, and other stationary sources of CO2. For example, a CCS project might capture CO2 from the stacks of a coal-fired power plant before it enters the atmosphere, transport the CO2 via pipeline, and inject the CO2 deep underground at a carefully selected and suitable subsurface geologic formation, such as a nearby abandoned oil field, where it is securely stored.
1 Atmospheric CO2 is part of the global carbon cycle, and therefore its fate is a complex function of geochemical and biological processes. Some of the excess carbon dioxide will be absorbed quickly (for example, by the ocean surface), but some will remain in the atmosphere for thousands of years, due in part to the very slow process by which carbon is transferred to ocean sediments.
2 IPCC (2013). Climate Change 2013: The Physical Science Basis. Contribution of Working Group I to the Fifth Assessment Report of the Intergovernmental Panel on Climate Change. [Stocker, T. F., D. Qin, G.-K. Plattner, M. Tignor, S. K. Allen, J. Boschung, A. Nauels, Y. Xia, V. Bex and P. M. Midgley (eds.)]. Cambridge University Press, Cambridge, United Kingdom and New York, NY, USA, 1585 pp.
Methane Emissions
Chemical Formula: CH4
Lifetime in Atmosphere: 12 years
Global Warming Potential (100-year): 25 1
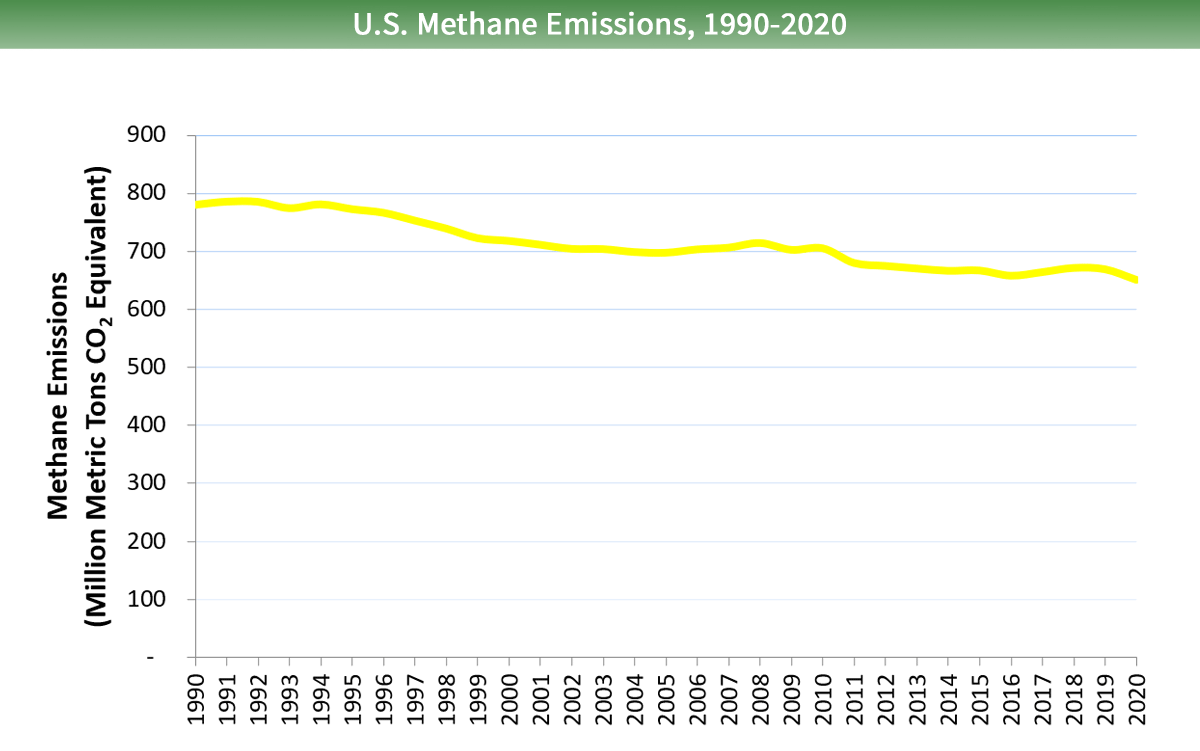
In 2020, methane (CH4) accounted for about 11% of all U.S. greenhouse gas emissions from human activities. Human activities emitting methane include leaks from natural gas systems and the raising of livestock. Methane is also emitted by natural sources such as natural wetlands. In addition, natural processes in soil and chemical reactions in the atmosphere help remove CH4 from the atmosphere. Methane’s lifetime in the atmosphere is much shorter than carbon dioxide (CO2), but CH4 is more efficient at trapping radiation than CO2. Pound for pound, the comparative impact of CH4 is 25 times greater than CO2 over a 100-year period. 1
Globally, 50-65% of total CH4 emissions come from human activities. 2, 3 Methane is emitted from energy, industry, agriculture, land use, and waste management activities, described below.
Methane is also emitted from a number of natural sources. Natural wetlands are the largest source, emitting CH4 from bacteria that decompose organic materials in the absence of oxygen. Smaller sources include termites, oceans, sediments, volcanoes, and wildfires.
To find out more about the role of CH4 in warming the atmosphere and its sources, visit the Climate Change Indicators page.
Emissions and Trends
Methane emissions in the United States decreased by 17% between 1990 and 2020. During this time period, emissions increased from sources associated with agricultural activities, while emissions decreased from other sources including landfills and coal mining and from natural gas and petroleum systems.
Note: All emission estimates from the Inventory of U.S. Greenhouse Gas Emissions and Sinks: 1990-2020. These estimates use a global warming potential for methane of 25, based on reporting requirements under the United Nations Framework Convention on Climate Change.
Reducing Methane Emissions
There are a number of ways to reduce CH4 emissions. Some examples are discussed below. EPA has a series of voluntary programs for reducing CH4 emissions, in addition to regulatory initiatives. EPA also supports the Global Methane Initiative, an international partnership encouraging global methane reduction strategies.
